Transforming Market Research: A Domain Report Feature Case Study
In the rapidly evolving landscape of AI-driven investment platforms, Mathlabs.io has emerged as a leader in providing transparent and trustworthy insights for Growth Investment and data mining. This case study explores how Mathlabs.io's Intelligent Operating System addresses the critical challenge of maintaining user trust while leveraging advanced AI capabilities.

About
Mathlabs specializes in advanced Natural Language Processing solutions that transform complex data into actionable insights. Led by a team of PhD mathematicians and engineering researchers, the company creates sophisticated information maps that uncover valuable patterns beyond human capability alone, serving global clients such as Fujitsu, Deutsche Bank, and Stanley Capital.
Brief Overview
Investment analysts needed to identify promising AgTech opportunities in a market with thousands of companies but lacked efficient tools to extract meaningful insights quickly. "We have the data but can't analyze it fast enough to act," noted one senior analyst, highlighting how traditional manual methods were failing in a rapidly evolving market.
User Pain Points & Challenges
Investment analysts needed to identify promising AgTech opportunities in a market with thousands of companies but lacked efficient tools to extract meaningful insights quickly. "We have the data but can't analyze it fast enough to act," noted one senior analyst, highlighting how traditional manual methods were failing in a rapidly evolving market.
Information Overload & Cluttered UI
Users struggled with long, text-heavy reports filled with raw data.
Analysts must manually filter large datasets for valid investment opportunities.
Inefficient Data Retrieval
Users had to manually sift through multiple sections to locate relevant metrics.
No search, filtering, or categorization options were available.
Lack of Interactivity & Customization
Reports were static, requiring manual formatting when users needed specific views.
Reports often fail to align with proprietary investment signals.
Slow Decision Making Due to lack of AI Asistance
Researching relevant companies takes days or weeks.
There were no automated insights to highlight important trends or risks.
Problem Statement
How might we design a domain report system that enables investment analysts to understand complex AgTech market dynamics, visualize relationships between companies and technology clusters, and extract valuable investment signals—providing immediate clarity on market opportunities while preserving the depth and comprehensiveness needed for strategic decision-making?
Research & Discovery
The design process was guided by in-depth research aimed at identifying user needs, pain points, and industry standards. This involved:
User Personas & Needs
Venture Capital Analysts & Investors – Need validated company data for high-growth investments.
Enterprise Market Intelligence Teams – Require automated competitive landscape reports.
Tech Commercialization Experts – Look for trends in new and emerging startups.Market and Competitive Analysis: Evaluated existing domain reporting solutions to identify strengths, limitations, and opportunities for innovation.
Competitive Analysis
Evaluated existing domain reporting solutions to identify strengths, limitations, and opportunities for innovation.
Domain Report Design Process and Decisions
During the design process, we were faced with multiple design decisions that required careful consideration and evaluation. Each choice aimed to align with our overall vision and objectives while addressing the various challenges.
Key Design Decisions
Adoption of Funnel Visualization
Challenge: Users needed to understand how they arrived at their final company list
Solution: Implemented a visual funnel showing the progression from 937 initial companies to 42 final matches
Rationale: Makes the filtering process transparent and helps users trust the results
Impact: Users can track each step of refinement and understand why companies were included or excluded
Multi-Layer Information Architecture
Challenge: Presenting complex company data without overwhelming users
Solution: Created three distinct information layers:
Executive summary for quick overview
Market clusters for pattern recognition
Detailed company profiles for deep dives
Rationale: Allows users to progressively discover information based on their needs
Impact: Reduced cognitive load while maintaining access to detailed information
Visual Design Decisions
The team implemented multiple visualization approaches to cater to different user needs and data representation requirements:
Tree Map Visualisation
A Tree Map is a visualization method that displays hierarchical data using nested rectangles. In the Domain Report context, it's used to show:
Market share distribution
Company categorization
Relative size of different sectors
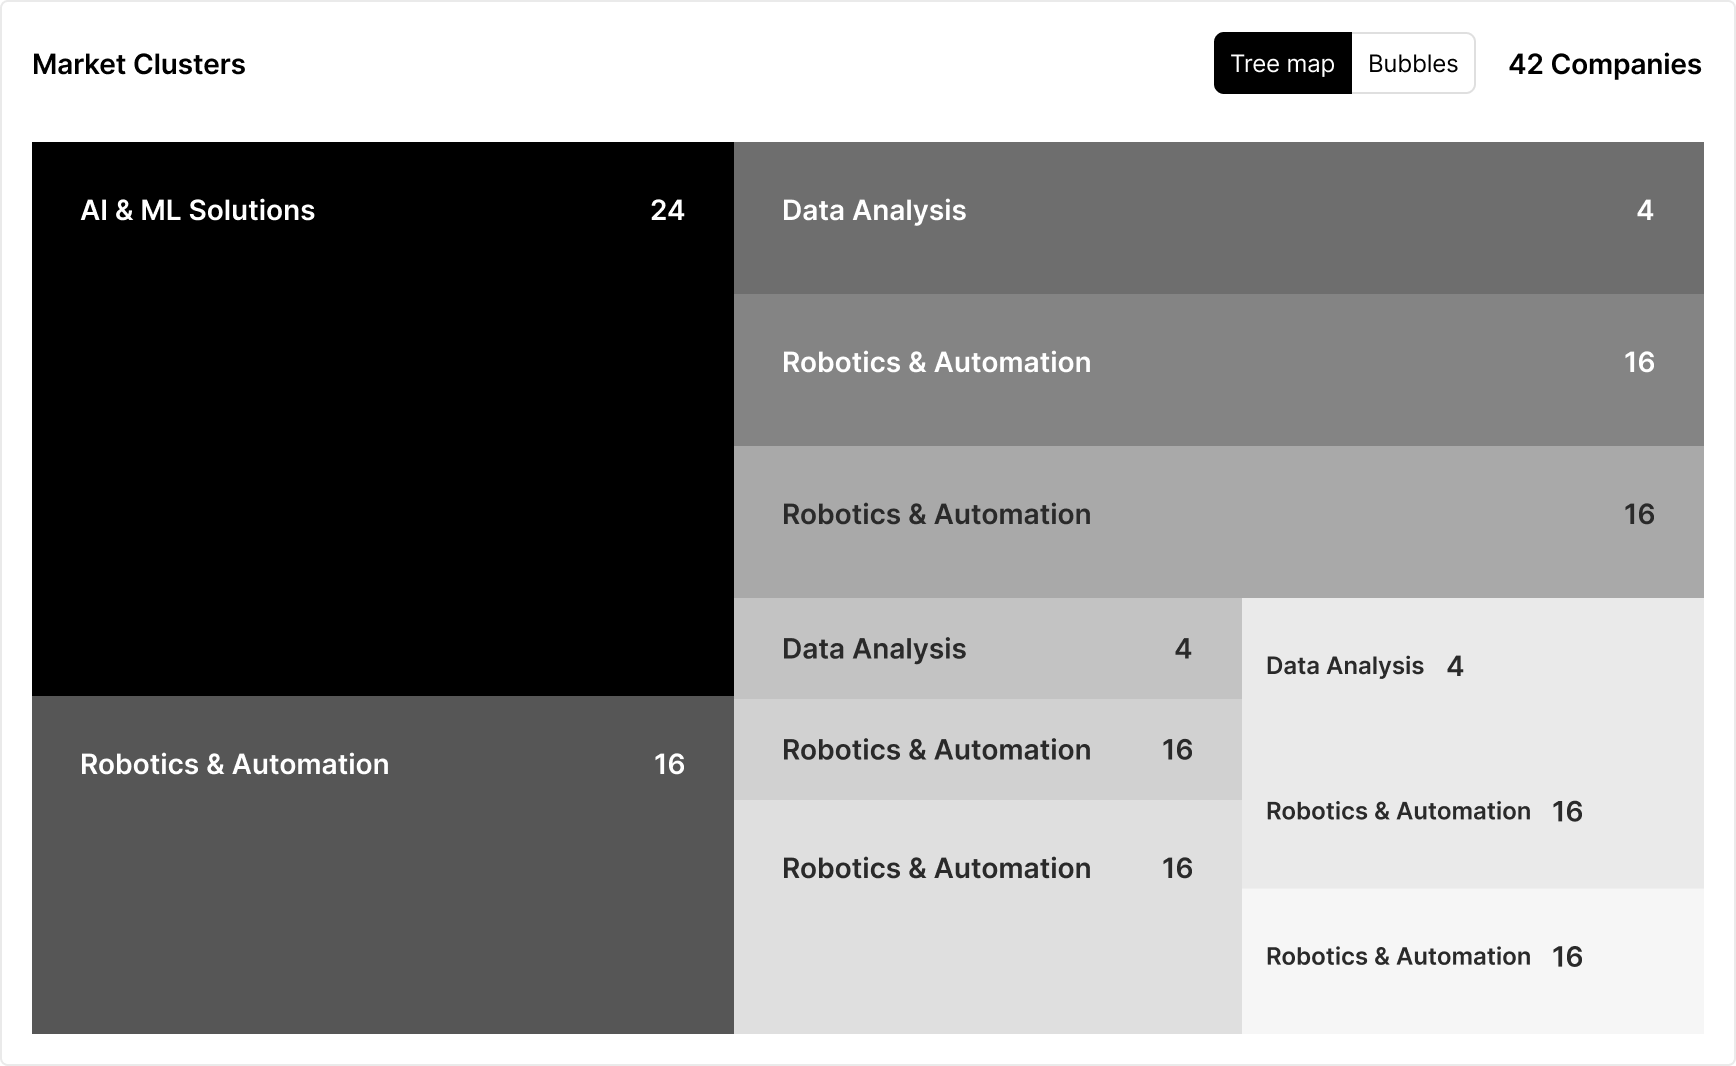
Purpose: Show hierarchical relationships and relative size
Design Decision: Used nested rectangles to represent market segments
Rationale: Efficient use of space while showing hierarchy
Implementation Details:
AI & ML Solutions (24 companies)
Robotics & Automation (16 companies)
Data Analysis (4 companies)
Funnel Visualisation
The funnel visualization that shows how we move from the initial dataset to the final list through applied filters.
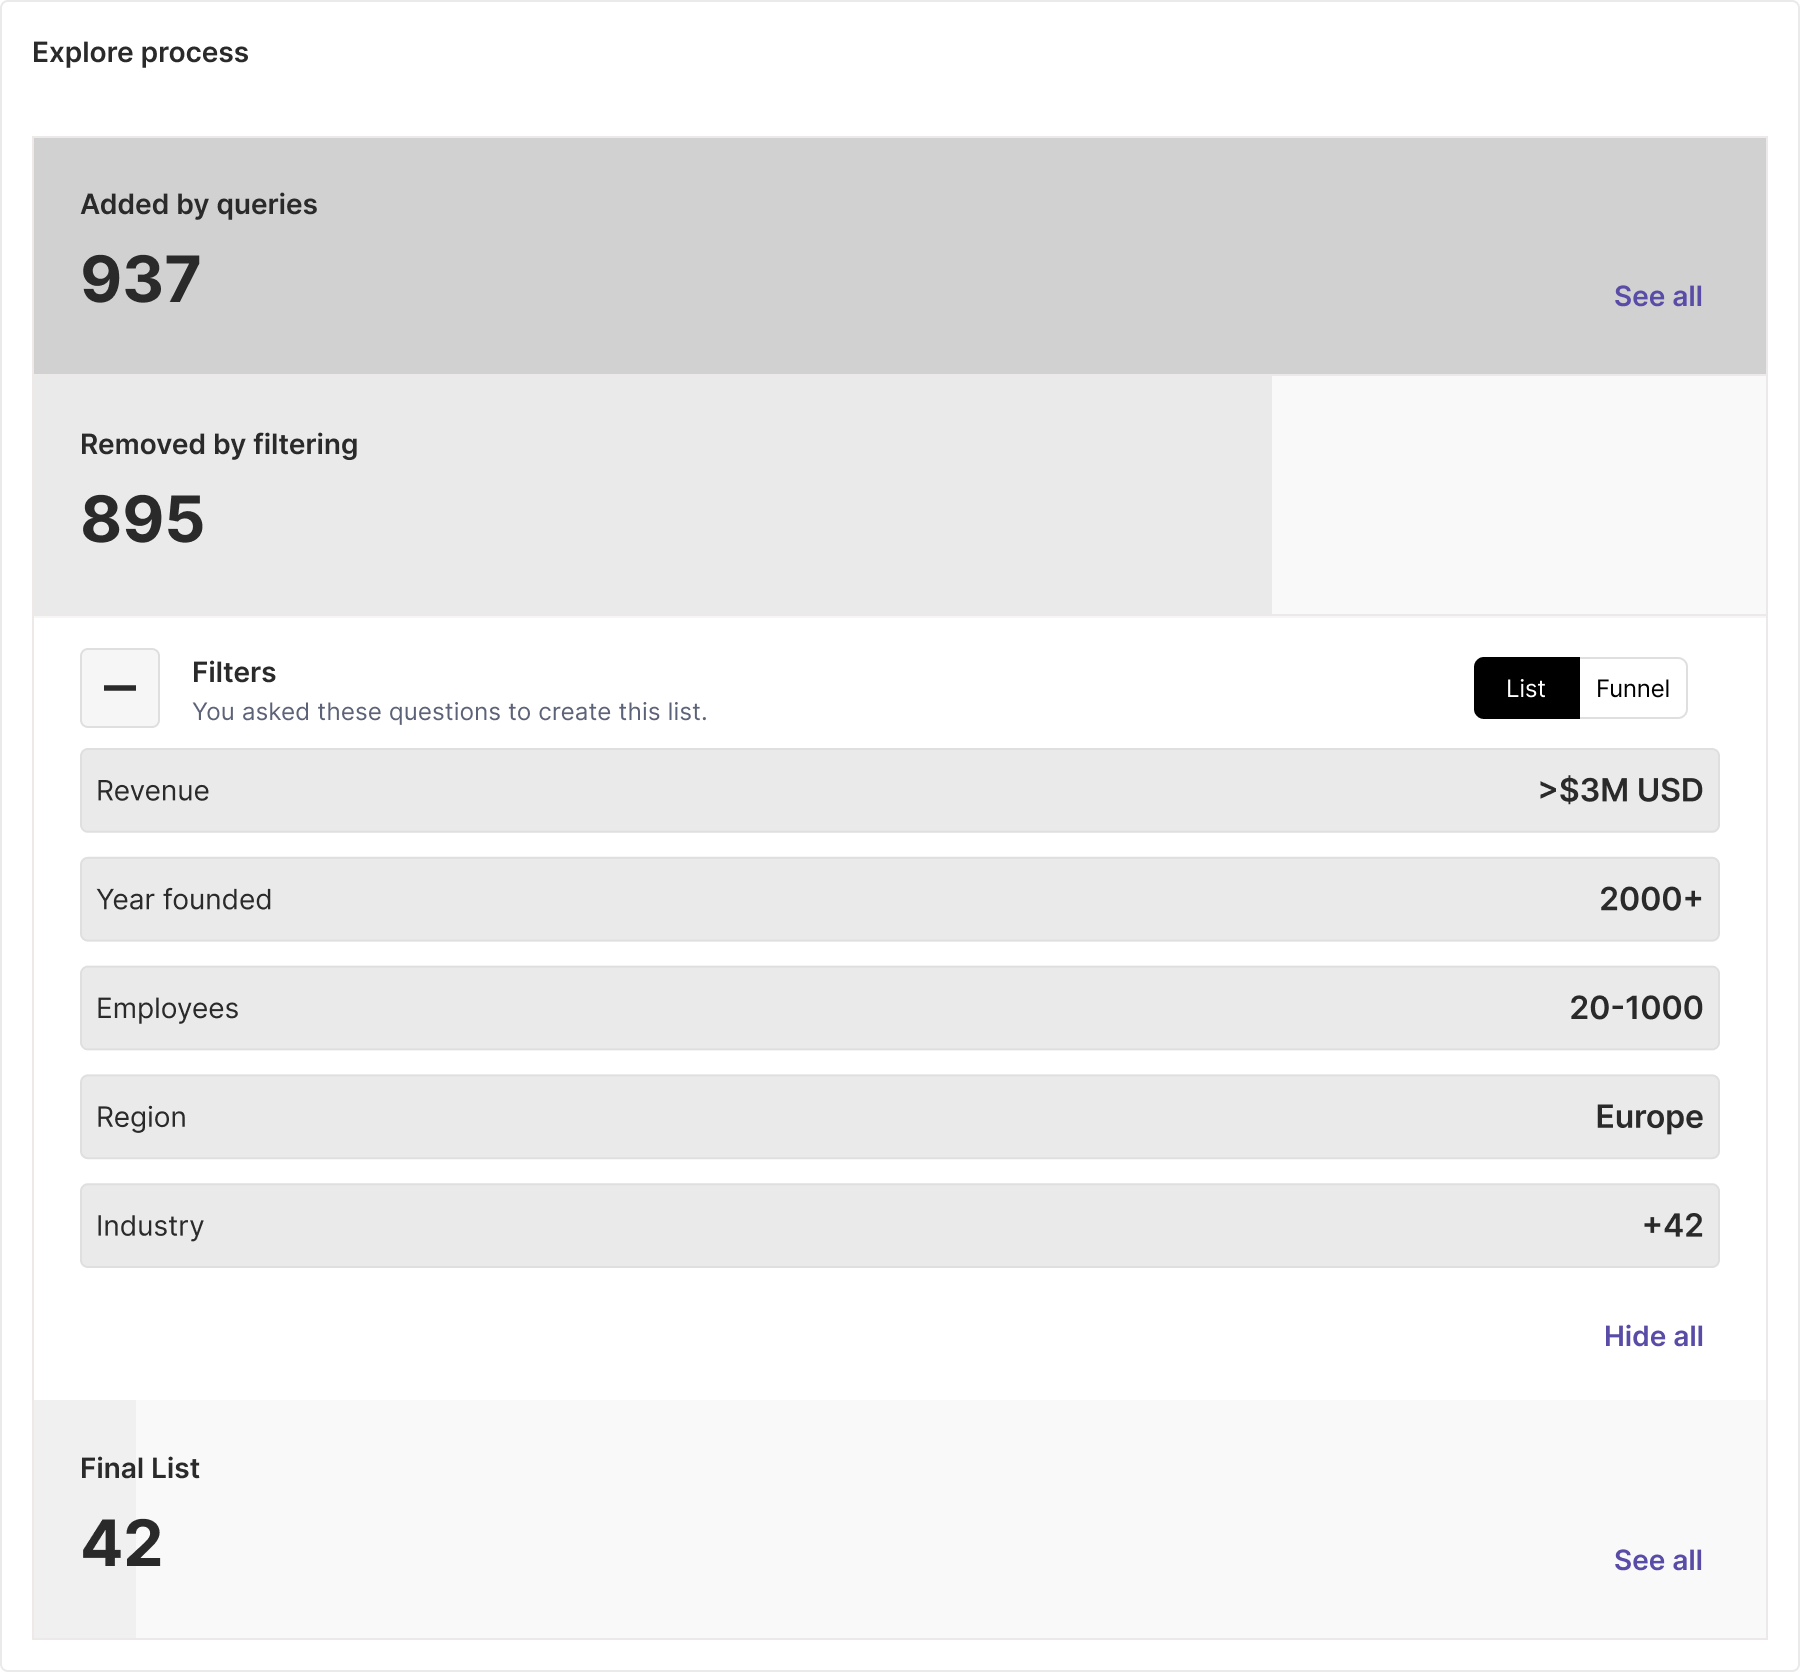
The funnel visualization helps users:
See how each filter affects the number of companies
Understand the filtering process step by step
Track how many companies remain after each filter
Visualize the narrowing of results from start to finish
Each level of the funnel shows:
The filter being applied
Number of companies remaining
Relative reduction in dataset size
Clear progression to the final selection
Technology Intelligence
The system continuously updates these insights as new data becomes available, ensuring analysts always have access to the most current market intelligence. What makes this insight generation particularly powerful is its ability to:
Connect the Dots: Identify relationships between seemingly unrelated market movements
Surface Hidden Patterns: Reveal trends that might not be obvious from traditional analysis
Generate Context: Provide relevant benchmarks and comparisons
Predict Movements: Offer forward-looking insights based on historical patterns
This automated insight generation transforms raw data into actionable intelligence, enabling analysts to focus on strategic decision-making rather than data gathering and analysis.
Automatic Insight Generation
The system doesn't just filter data – it actively generates insights throughout the research journey. Here's how the insight generation process works.
The system employs multiple layers of analysis to automatically generate insights throughout the research process:
Market Landscape
The domain report provides a comprehensive view of the agricultural robotics market, revealing key metrics and distributions that shape investment decisions:
Company Demographics
Revenue Structure
Investment Profile
Geographic Distribution
Historical Development

Top Problems being Solved
What makes this aspect of the domain report feature particularly valuable is how it restructures company data around problem spaces rather than traditional metrics.
In the context of the domain report feature, this problem-solution mapping provides several key benefits:
Strategic Context: It helps investors understand not just what companies do, but why their solutions matter in the larger market context.
Cross-Company Comparison: It enables direct comparison of different technological approaches to solving the same problem.
Multi-Category Players: It highlights companies like Saga Robotics that address multiple high-value problem areas, potentially indicating more robust business models.
White Space Identification: By organizing the market by problems being solved, it becomes easier to identify underserved areas that might represent investment opportunities.

Comprehensive Market Intelligence
Final Domain Report Results and Impact
The Domain Report feature delivers several tangible outcomes that transform how investment analysts understand and navigate market.

The final domain report synthesizes multiple data dimensions into a cohesive market narrative:
Problem-Solution Landscape
Market Structure Visualization
Financial Overview
Strategic Value for Users
The domain report transforms raw data into strategic intelligence that drives better decisions:
Contextual Understanding: Users understand not just individual metrics but their meaning within the broader market context.
Pattern Recognition: The system automatically identifies trends like the concentration of company founding in the 2010s, indicating market maturity.
Relationship Mapping: The report reveals connections between companies addressing similar problems with different technological approaches.
Opportunity Identification: By organizing the market around problems rather than just companies, the report helps identify underserved areas or promising solution approaches.
Evolving Intelligence
As a living document, the domain report continues to provide value over time:
New companies are automatically incorporated as they emerge
Market trends are tracked and updated
Historical data provides context for current developments
Predictions become more refined as the system ingests more information
For investment analysts, the domain report has transformed market research from a time-consuming necessary evil into a strategic advantage, enabling them to identify promising opportunities faster and with greater confidence than competitors using traditional research methods.